A crystal-clear picture of the world’s winners and losers in the last generation
Source: The Story of Globalization in 1 Graph – The Atlantic
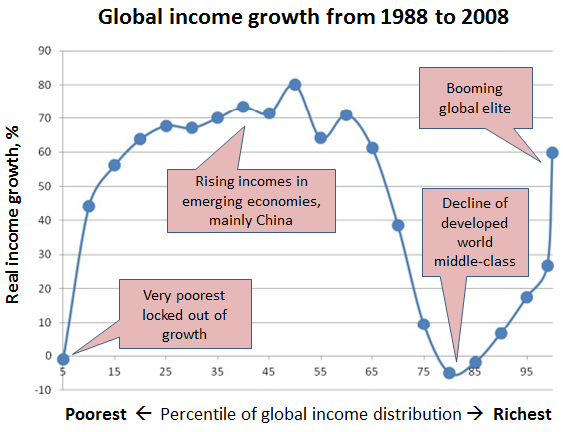
Sometimes a graphic inspires us not by its creative animations or mesmerizing interactive elements, but by how much it can explain with how little. That’s why we like this chart from Branko Milanovic, lead economist at the World Bank’s research department (as annotated by James Plunkett, policy director at U.K. think tank Resolution Foundation). Milanovic likes to call it, “How the world changed between the fall of the Berlin wall and the fall of Wall Street.”
Source: Chart of the Week: How two decades of globalization have changed the world | Pew Research Center
RE: https://twitter.com/jamestplunkett/status/425909152217444352/photo/1