How “Money Printing” Works, and how to Spot Inflation, by Lyn Alden

Source: How “Money Printing” Works, and how to Spot Inflation, by Lyn Alden

The crux of this article is that quantitative easing on its own, and quantitative easing combined with massive fiscal deficits, are two very different situations to consider when it comes to analyzing the possibilities between inflation and deflation, and what constitutes “money printing”.

Base money vs. broad money supply
Bank lending, bank reserves, and QE (quantitative easing)
Deflationary forces

QE alone, where the Fed buys existing assets mostly from banks, is simply anti-deflationary, to recapitalize a banking system and fill it up with excess reserves. It’s not outright inflationary because it doesn’t directly increase the broad money supply. If the Fed buys existing assets from non-banks, it only increases broad money a bit, around the margins.

Meanwhile, large fiscal deficits funded by QE (the central banks monetizing deficit spending by buying any of the excess Treasuries over the real demand for them), actually is pro-inflationary, because it gets money directly into the economy, into the broad money supply, and can be done with no limit except for inflation that it would eventually cause when done to excess.

The Framing of the Developer | svese

Source: The Framing of the Developer | svese, by Stephan Schmidt

“In the social sciences, framing comprises a set of concepts and theoretical perspectives on how individuals, groups, and societies, organize, perceive, and communicate about reality.” Wikipedia

Framing is intentionally and unintentionally used in discussions and environments. A frame shapes the discussion and makes some things thinkable and some other things unthinkable. Frames have friends that go with them.

We have a dominant frame in development. Software development as a “backlog”. Features are put in a backlog by a product manager – the product owner – and by different departments. According to the Cambridge dictionary a backlog is “a large number of things that you should have done before and must do now”. The word backlog makes you think you are always behind finishing things. The frame says: Finishing means success. If we work from the backlog, we’ll have success. If we complete all the things I as a product owner have in my vision, we will have success.

Companies today need a frame of impact. In this world view success is defined by impact. Do product and technology develop products and features that have impact? Impact means impact for the company and impact for the customers. For the company this feature, or product moves the needle. For customers it changes their behavior.

The impact frame helps to focus on the important things. If success is defined by throughput and finishing a backlog, the more things you do the more successful you are – which leads to many features developed that are not important to customers. Backlog success is input driven product development. It focuses on the input. Impact development is outcome driven. It focuses on outcome. … This means we need to do things that have impact and no longer focus on things that have no impact. … Failure is when we don’t have impact. In this frame it becomes crucial to choose things that have impact and not work on things that do not have impact. It is key to throw away most of the ideas you have and only stick with the very few that will change your customer or the market. … Also throw out ideas that are already in development. You’ve put time, energy and money into something and learned that it will not have impact? Stop! Throw it out.

The illusion of certainty, by Rory Sutherland

Source: The illusion of certainty, by Rory Sutherland

at stake is the difference between deterministic and probabilistic improvement. If you engage engineers, you don’t know what you are going to get. You may be unlucky and get nothing. Or their solution may be so outlandish that it is hard to compare with other competing solutions. On average, though, what you get will be more valuable than the gains produced by some tedious restructuring enshrined in a fat PowerPoint deck.

But in business, let alone in government, it is only in crises that people find a budget for probabilistic interventions of this kind (in peacetime, nobody would have given Barnes Wallis the time of day). The reason is that both bureaucrats and business people are heavily attracted to the illusion of certainty. Standard cost-cutting ‘efficiencies’ can usually be ‘proven’ to work in advance; more interesting lines of enquiry come with career-threatening unknowability.

One problem with this pretense of certainty is that cost-savings are more easily quantified than potential gains

for a long time, the ratio between ‘explore’ and ‘exploit’ has been badly out of whack.

use [an] ‘evidence-based’ data-model up to a point, but correct for the fact that it is incomplete, temporary and weighted to the past. Institutionalised humans obtain a false sense of certainty by assuming … that what is optimal in a one-off transaction in a certain present is also optimal at scale, in an uncertain, long-term future.

S&P 500 Buybacks Now Outpace All R&D Spending in the US | The Sounding Line

Source: S&P 500 Buybacks Now Outpace All R&D Spending in the US | The Sounding Line, by Taps Coogan

The United States engaged in roughly $608 billion worth of research and development in 2018. That figure includes R&D by all entities in the US, from universities to private and public corporations. During the same year, corporations in the S&P 500 spent $806 billion buying back their own stock. In other words, the 500 largest companies in the US are now spending 33% more on their stock buyback programs than the entire country is investing in R&D.

Economists are rethinking the numbers on inequality | The Economist

Source: Economists are rethinking the numbers on inequality | The Economist

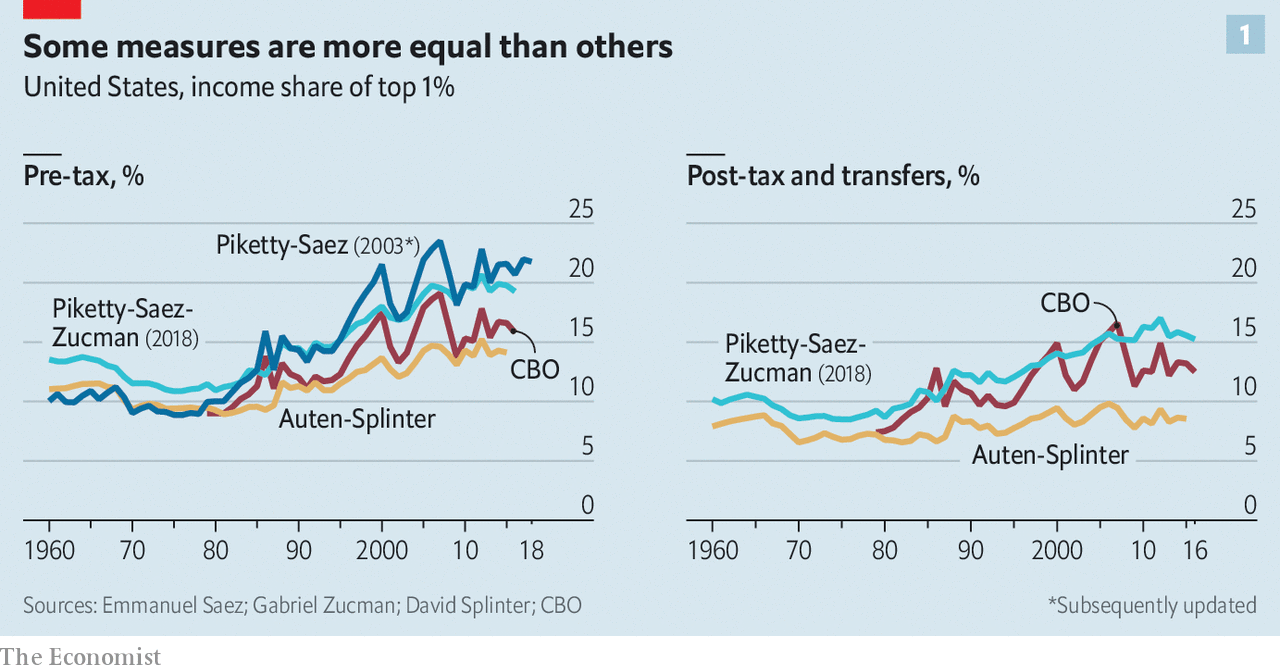
Yet just as ideas about inequality have completed their march from the academy to the frontlines of politics, researchers have begun to look again. And some are wondering whether inequality has in fact risen as much as claimed—or, by some measures, at all. It is fiendishly complicated to calculate how much people earn in a year or the value of the assets under their control, and thus a country’s level of income or wealth inequality.

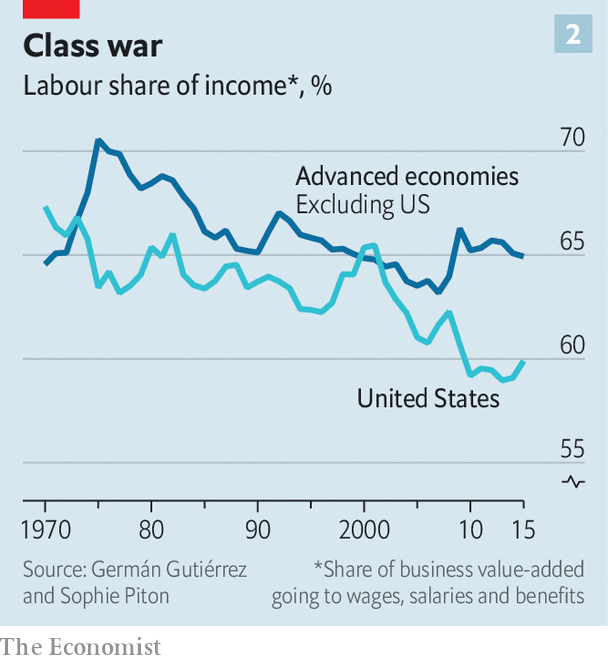
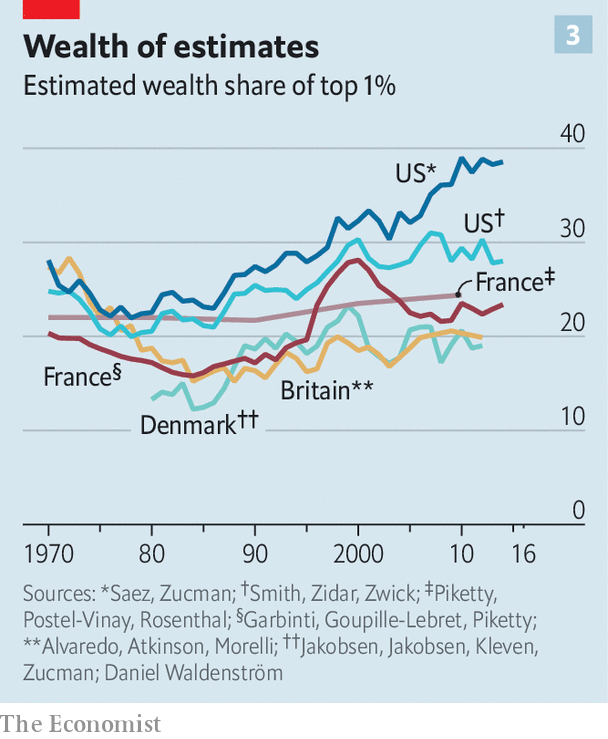
The conventional wisdom to have emerged from [recent wealth and income research] revolves around four main points. First, over a period of four to five decades the incomes of the top 1% have soared. Second, the incomes of middle-earners have stagnated. Third, wages have barely risen even though productivity has done so, meaning that an increasing share of GDP has gone to investors in the form of interest, dividends and capital gains, rather than to labour in the form of wages. Fourth, the rich have reinvested the fruits of their success, such that inequality of wealth (ie, the stock of assets less liabilities such as mortgage debt) has risen, too.

Each argument has always had its doubters. But they have grown in number as a series of new papers have called the existing estimates of inequality into question.


Few dispute that wealth shares at the top have risen in America, nor that the increase is driven by fortunes at the very top, among people who really can be considered an elite. The question, instead, is by just how much. … Proposals for much heavier taxes on high earners, or a tax on net wealth, or the far more radical plans outlined in Mr Piketty’s latest book, are responses to a problem that is only partially understood.